Stock & Options Tracking / 6 MIN READ
Bull Call Debit Spread Calculator: Max Profit, Loss & Breakeven
See how a bull call debit spread calculator derives maximum profit, maximum loss, breakeven, and expiration payoff, with a worked 100/105 example and fees.
A bull call debit spread is a defined-risk bullish position with two call legs on the same underlying and expiration: you buy the lower-strike call and sell the higher-strike call. You pay a net debit to open it, so the maximum loss is known when you enter. The open questions are how much the spread can pay if the underlying finishes above the short strike, and where it starts to make money.
This guide works through the arithmetic behind the free credit and debit spread calculator, using fictional examples. It is an educational explanation of payoff math, not a recommendation to enter a trade.
What the calculator reports
After you enter a strategy, strikes, net debit per share, contracts, and optional fees, the calculator returns:
- Maximum profit if the spread finishes at or above the short strike
- Maximum loss if it finishes at or below the long strike
- Breakeven after fees, the underlying price where the position neither makes nor loses money
- Risk/reward, the maximum loss per $1.00 of maximum profit, after fees
- Expiration P&L across a range of underlying prices
All figures are theoretical values at expiration for a standard 100-share multiplier contract. They are not a forecast.
Bull call debit spread formulas
Let the strike width be the absolute difference between the two strikes. For a bull call spread, the long call strike is the lower one.
- Gross debit = net debit per share × contracts × 100
- Maximum loss = gross debit + fees
- Maximum profit = (strike width − net debit per share) × contracts × 100 − fees
- Net debit per share after fees = net debit per share + fees ÷ (contracts × 100)
- Breakeven = long call strike + net debit per share after fees
- Expiration P&L = max(0, underlying price − long call strike) × contracts × 100 − max(0, underlying price − short call strike) × contracts × 100 − gross debit − fees
The short call caps the gain at the strike width. Once the underlying is above both strikes, the two options move together and the payoff stops growing.
Worked example: a 100/105 bull call debit spread
Suppose you buy one 100-strike call at $4.00 and sell one 105-strike call at $2.00, for a net debit of $2.00 per share. Total commissions and fees are $4.00.
- Strike width: $5.00
- Gross debit: $2.00 × 1 × 100 = $200.00
- Maximum loss: $200.00 + $4.00 = $204.00
- Maximum profit: ($5.00 − $2.00) × 1 × 100 − $4.00 = $296.00
- Net debit per share after fees: $2.00 + $0.04 = $2.04
- Breakeven: $100.00 + $2.04 = $102.04
- Risk/reward: $204.00 ÷ $296.00 = 0.69 : 1
At expiration, this fictional spread would lose the full $204.00 at or below $100, cross breakeven at $102.04, and pay the maximum $296.00 at or above $105.
Fees matter in both directions. Without the $4.00 in fees, the same spread would show a $200.00 maximum loss, a $300.00 maximum profit, and a $102.00 breakeven. That is why the calculator asks for fees separately instead of hiding them in the quote.
Worked example: scaling to two contracts
Now suppose you buy two 50-strike calls and sell two 55-strike calls for a net debit of $1.60 per share, with $4.00 in total fees.
- Strike width: $5.00
- Gross debit: $1.60 × 2 × 100 = $320.00
- Maximum loss: $320.00 + $4.00 = $324.00
- Maximum profit: ($5.00 − $1.60) × 2 × 100 − $4.00 = $676.00
- Net debit per share after fees: $1.60 + $0.04 = $1.62
- Breakeven: $50.00 + $1.62 = $51.62
- Risk/reward: $324.00 ÷ $676.00 = 0.48 : 1
The second example shows why per-share figures and total dollars must not be mixed. The debit is quoted per share, the multiplier is 100, and fees are charged per fill, so doubling the contracts doubles the gross debit but not the fee total unless you add it yourself.
Where the arithmetic goes wrong
- Treating the debit as the maximum loss. The paid debit is the floor, but fees sit on top of it. A $200.00 debit with $4.00 in fees has a $204.00 theoretical maximum loss.
- Assuming you keep the full strike width. You paid a debit, so the width is reduced by the net debit before fees.
- Reversing the strike order. A bull call spread buys the lower strike and sells the higher strike. If you enter them the other way around, the calculator rejects the input because it is no longer a debit vertical.
- Forgetting the short leg. The sold call caps the payoff. Above the short strike, extra upside in the underlying does not add to profit.
- Comparing risk/reward across different denominators. A 0.69 : 1 ratio describes maximum loss per $1.00 of maximum profit after fees. It is not a probability of profit.
- Ignoring early assignment on the short call. An in-the-money short call can be assigned before expiration, especially around a dividend, which can change the position and the result.
Assumptions and limits
- Standard 100-share multiplier. Adjusted contracts or other deliverables are not supported.
- Defined-risk vertical spread. Both legs are assumed to share the same underlying, expiration, and option type.
- Expiration-only theoretical payoff. Mid-trade marks, implied volatility, theta, bid/ask spreads, and liquidity are not modeled.
- No early assignment or exercise modeling. Pin risk, dividend risk, and stock delivery are excluded.
- No taxes, interest, dividends, or slippage. Fees are entered as one combined dollar amount.
- Educational use only. This is not investment, tax, or legal advice.
From a payoff estimate to a record
Estimating the expiration payoff is one step. Once the position is open, the fills, adjustments, and final result still need a record you can reconcile.
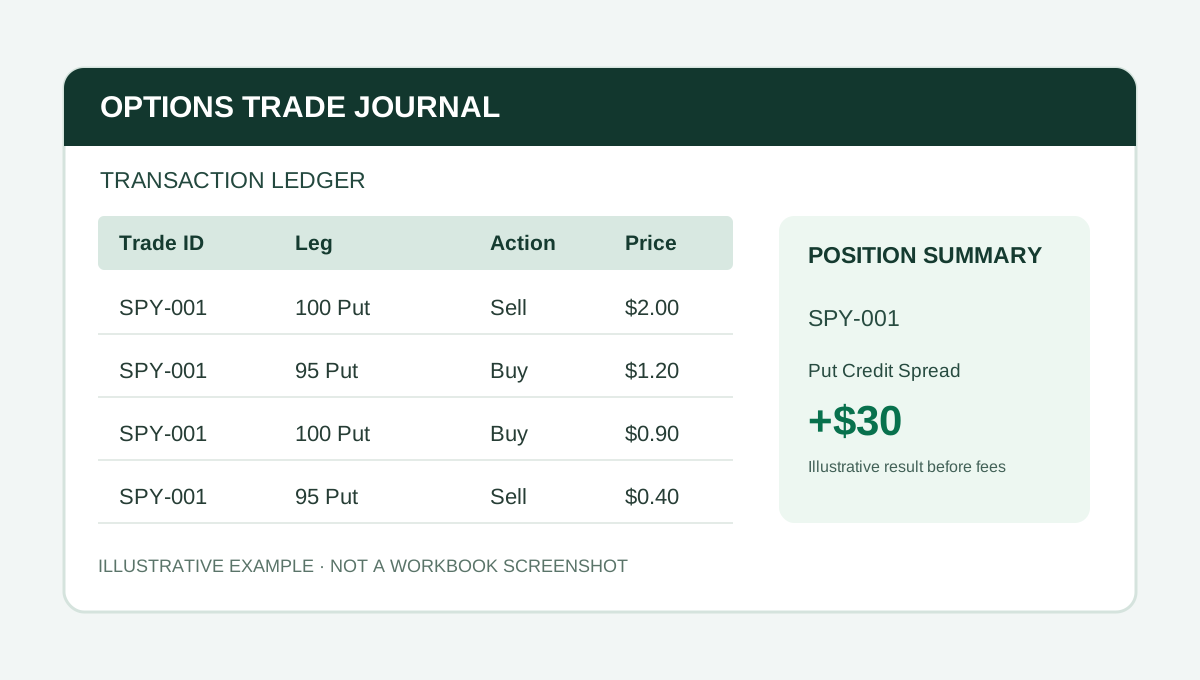
Options Command Center from The Finance Desk is an Excel workbook that groups multi-leg fills, rolls, and adjustments under a shared Trade ID, with position and strategy reporting. It is a manual workbook with CSV staging, not a live broker connection. For the recordkeeping side in more detail, read how to calculate credit spread profit and loss in Excel and what to track in an options trading journal spreadsheet.
Related guides
For the mirror-image bearish debit position, see the bear put debit spread calculator guide. To journal multi-leg positions, read how to track credit spreads and iron condors in Excel and how to track rolled options in Excel. When you are ready to run the numbers, open the free credit and debit spread calculator or browse the stock and options tracking desk.
Volatility, assignment, and execution costs can all change a real outcome. Treat every result from the calculator as a theoretical expiration payoff and confirm contract details, fees, and assignment risk with your broker.
PUT IT INTO PRACTICE
Options Command Center
Connect fills, legs, rolls, and adjustments by Trade ID, with position summaries and strategy reporting.
View Options Command Center on PayhipCheck Payhip for current pricing and compatibility.
Educational content. Examples are fictional and should be adapted and checked against your own reporting policies.
More from Stock & Options Tracking →